Finding the cause of lag spikes
Lag spikes occur when a small number of ticks (or sometimes just one tick) takes a long time to execute.
This can either happen quite frequently, e.g. 1 in every 20 ticks, or rarely, e.g. once every minute. They're usually related to player behaviour.
Finding the cause of lag spikes just from looking at normal profiling data can be tricky, because the data is averaged. All of the other samples will "cancel out" the spike, and mask their impact.
Luckily, spark has two useful tools to workaround this.
Step 1: Use /spark tickmonitor to detect the lag spike
In order to identify the cause of the lag spike in a profiling report, we need to be able to separate the "spike" tick from all of the others.
We can use the /spark tickmonitor command to do this.
This command works by first establishing the average tick rate of the server, and then:
- Monitors the time taken for each subsequent tick
- Calculates the difference (as a percentage) between the time taken to execute the last tick and the average
- Sends a message in chat if the difference is over a certain threshold
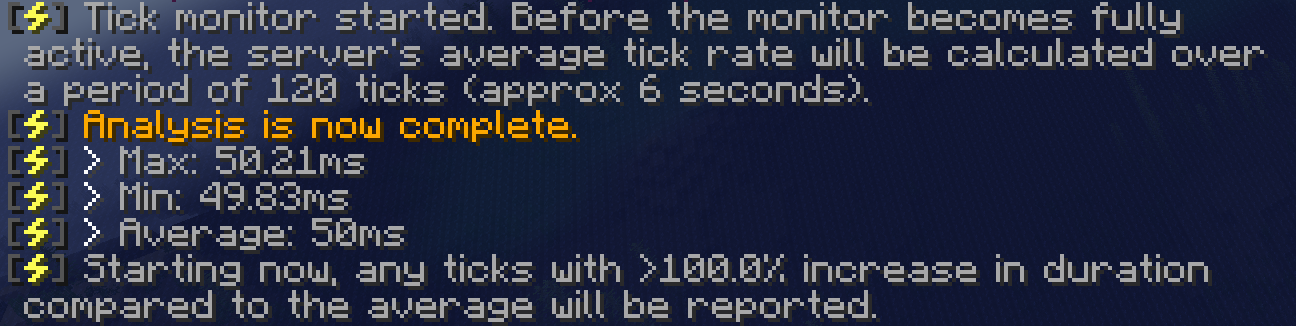
To enable the monitoring, just run /spark tickmonitor
By default, the threshold is 100% (a 100 percent increase means the tick took twice as long as average).
You can also specify the threshold top be an absolute tick duration, for example /spark tickmonitor --threshold-tick 50 to report any tick which exceeds 50 milliseconds (this is the point at which the server has to start catching up, or lagging).
Then, you just have to wait. If the spikes you're experiencing are noticeable in gameplay, then try to line up the effects on the spike in-game with the monitoring output.
If the output isn't sensitive enough, try a lower threshold, e.g. /spark tickmonitor --threshold-tick 70.
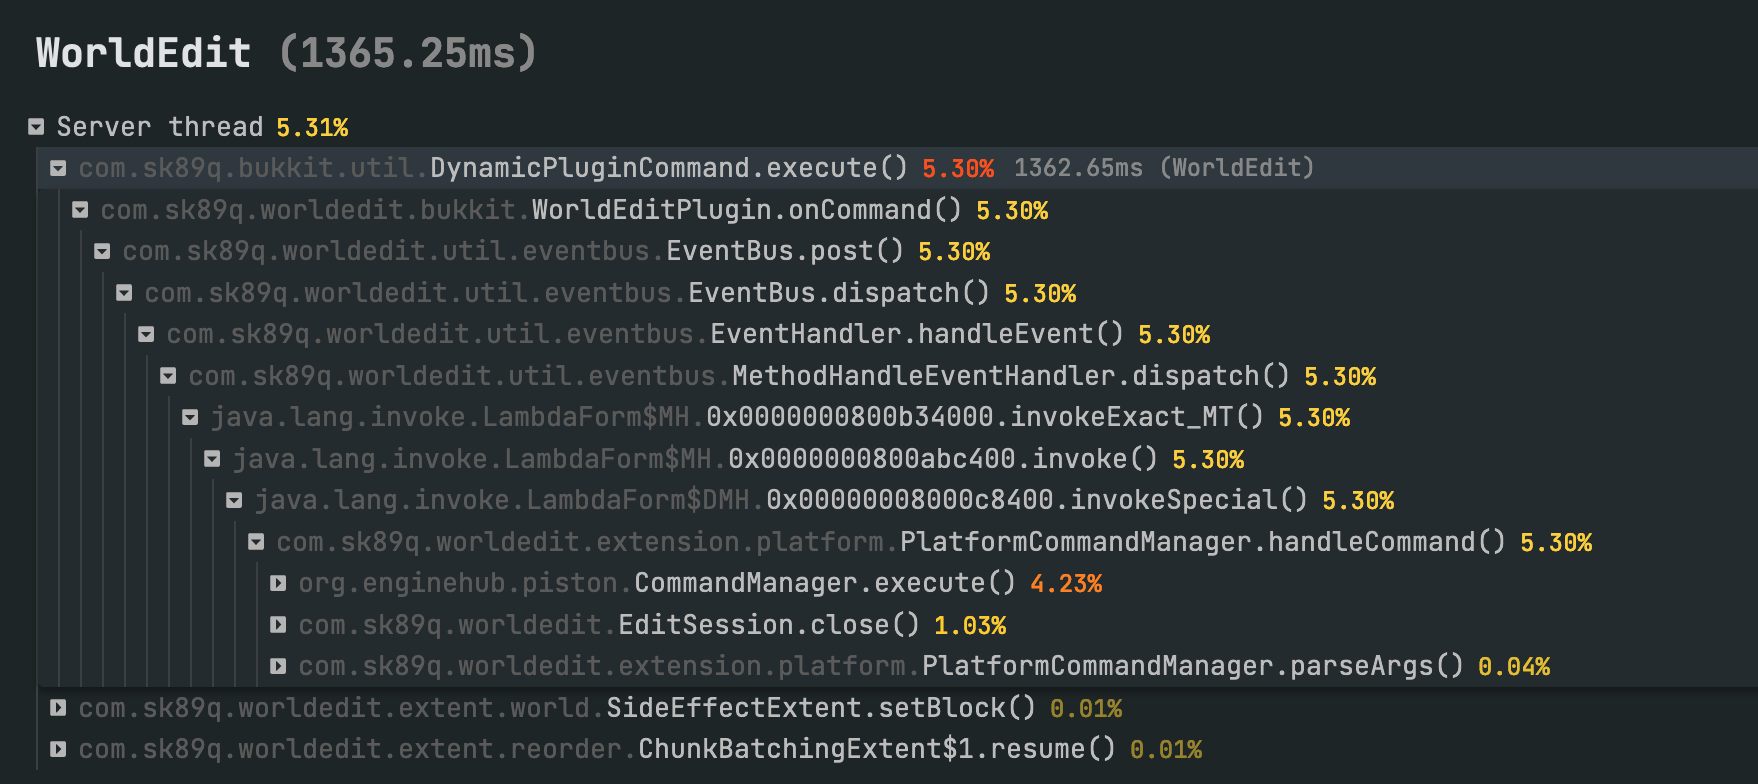
For the sake of explaining here, I'm going to "create" a lag spike using WorldEdit. :)

As you can see, the ticks when the WorldEdit action was executing saw increases of over 1000%!
Step 2: Use /spark profiler with --only-ticks-over to find the cause
The --only-ticks-over option means that spark will only profile game ticks that last longer than the given threshold. This filters out all of the "normal" game-stuff and just leaves the laggy ticks to worry about.
You can use Step 1 to determine a good threshold value, I recommend using a value between 50 and 100 - but it should always be less than the duration taken by "laggy" ticks.
For example, the laggy actions identified in my example in step 1 were over 300 milliseconds, but just to be sure they'll be included, I'll use a lower threshold of 150 milliseconds.
Then run, for example, /spark profiler --only-ticks-over 150.
This will start a new profiler, but will only include samples from ticks that took over 150ms to execute.
Once complete, open the viewer and inspect the profile as normal. Hopefully the laggy areas will be especially clear. :)
For example...