Using the viewer
Once you have created a profile using the /spark profiler command, your profile will be automatically uploaded to the viewer, and you will be presented with a link.
You can freely share this link with other people, send it to someone helping you or to a plugin/mod developer to point out a problem!
Interpret the profiler tree
When first presented with the profiler output, it can be a bit daunting and difficult to understand at first.
This is partially because the only information spark has and can present is the underlying class/method names (i.e. the names that programmers used in the code) to describe what's going on. However, with a little bit of thinking and some common sense, you can quickly figure out what's going on.
Try to persevere! There are some explanations below which will help you understand the output. 😃
Threads
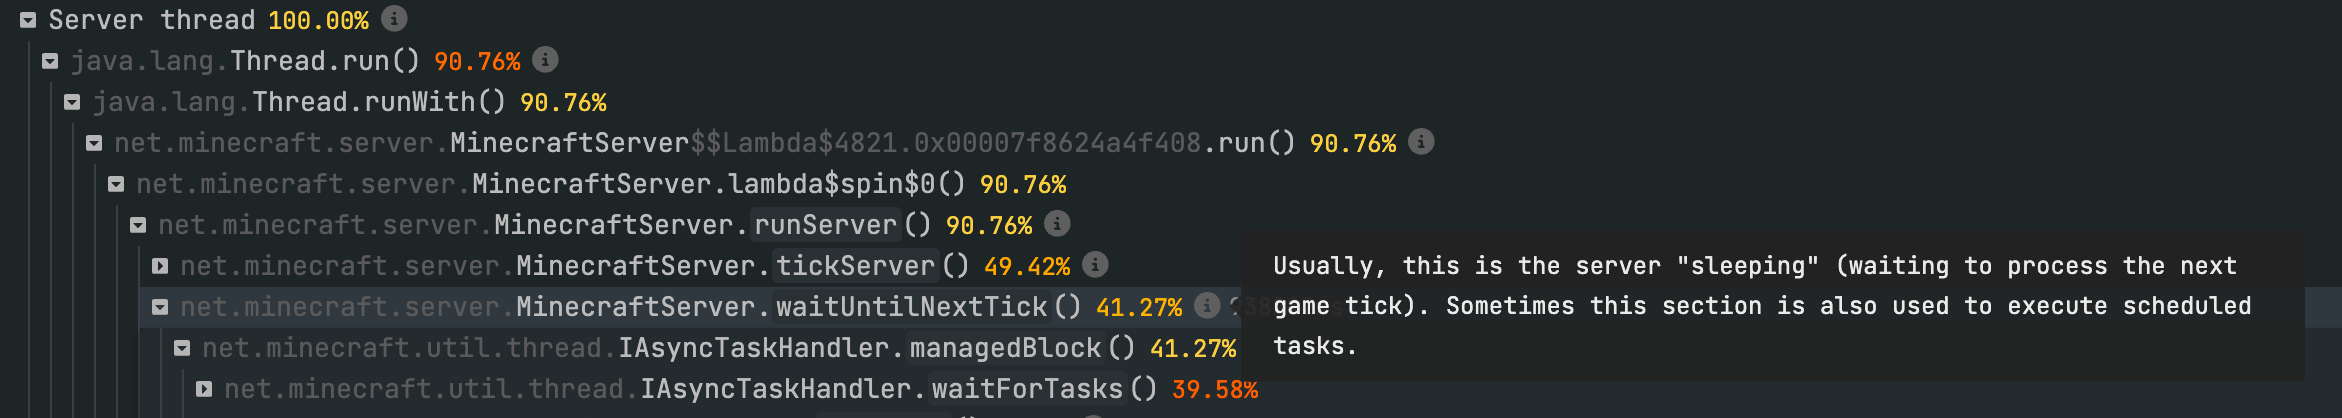
When you first open the viewer, you will be presented with a list of the threads which were profiled.
You can think of a thread like a worker that's performing some specific task within the client/server/whatever. In the case of Minecraft servers, the thread we are usually most interested in is the "Server thread", which is the main thread responsible for running the game.
![]()
Call Frames ("nodes")
We can see three pieces of information for each call frame in the profiler tree. The name, the percentage of time taken by the frame compared to the total amount taken by the thread, and the number of milliseconds taken (only shows on hover).
Threads (at the root/top of the profile) will always show 100% next to them - this is because 100 percent of the time spent profiling the thread was, well, spent within that thread.
When you hover over a node in the profiler tree, the time the sampler predicted was spent executing it during the profile will be shown to the right.
Info points
Some well-known/notable call frames display with an ⓘ info point symbol next to them.
If you hover over the symbol, the viewer will display some extra information about what the call frame relates to.
These descriptions are open-source (can be quite easily edited/changed/improved by community members!), so if you notice anything that looks incorrect or think there is a thread/method call that deserves an extra description, please consider contributing it! 😎
Expanding the profile
You can click on a node to view its children. These will be expanded out below it.
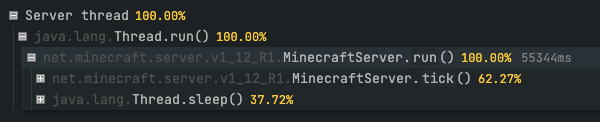
When expanding "Server thread" in this example program:
- the only child is
java.lang.Thread.run()- this is just the server thread entry point, we can ignore it. - the only child of that is
MinecraftServer.run()- ok great! This is the entry point to the Minecraft server. - the two children of that are
MinecraftServer.tick()andThread.sleep().
As explained in the tick loop guide, any time spent sleeping (or with a thread "parked") is healthy! We can probably ignore that.
However, MinecraftServer.tick() is where the work happens. We can click to expand further.
Analysing the profile
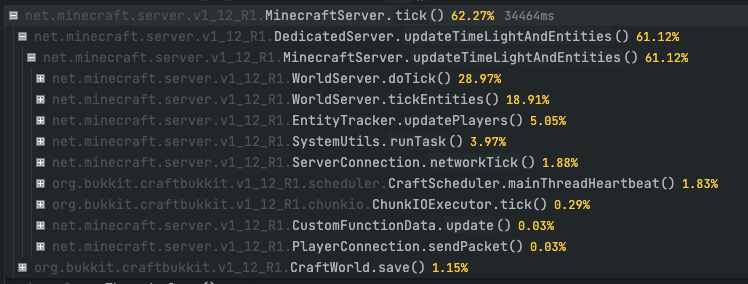
At this stage, we can see distinct parts of the server executing and showing up in our profile.
Some key things we can see already:
WorldServer.doTick()- probably "ticking" the world - blocks, redstone, etc.WorldServer.tickEntities()- probably "ticking" entities - seems like a safe guess!CraftScheduler.mainThreadHeartbeat()- this is CraftBukkit executing plugin scheduler tasks- ... and so on - you can usually make a good guess about what's going on!
Of course, if you don't know what the method name refers to, or if more detail is needed (it usually is): you can expand the nodes more.
How to find the cause of a performance problem
Now you know how to navigate the tree, the trick to finding "problematic" areas is to just follow the numbers - specifically, the percentages shown next to each node.
These percentages indicate how much time was spent in that area.
So, if you keep expanding the tree, following which areas have relatively high percents - you will eventually find the problem - hopefully!
An example of this process is demonstrated in the Finding lag spikes guide.
Apply deobfuscation mappings
The Minecraft client/server obfuscates ("scrambles, makes hard to interpret") all method and class names. This is obviously a slight problem when trying to find out what is causing a performance issue!
Luckily, the viewer can apply deobfuscation mappings ("unscramble") the names for us.
By default, the viewer will automatically detect which mappings to apply. However, if this doesn't work, you may need to select the correct mappings manually.
You can do this using the dropdown menu in the top right of the page.

Bookmark a method call
When analysing your profile, you may come across a noteworthy method call which you want to save to refer back to later or to show to someone else.
The easiest way to do this is to "bookmark" the method.
You can do this by holding down the alt key and clicking on the method call.
You can also right-click on the method call, then select "Toggle bookmark".
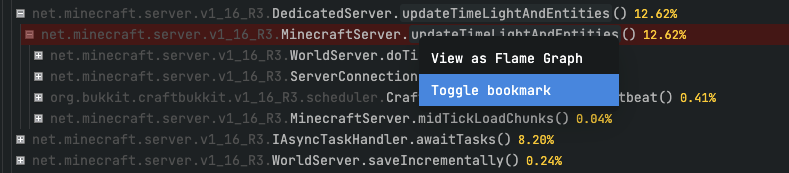
You will notice the method will become highlighted red.
Additionally, a special query parameter will be added to the URL in your browser window to "encode" the bookmark. If you share this modified link with someone else, when they open the viewer your bookmarked methods will be highlighted and automatically expanded for them too!
Views
The profiler viewer supports a few different views (modes).
You can toggle between the different views by clicking the 👁️ view button in the top controls bar.
All View
This is the default profiler view. The shows the entire profile as an expandable tree.
Flat View
The flat view shows a flattened representation of the profile, where the slowest 250 method calls are listed at the top level. This is a useful way to see which method calls are taking the most time overall.
The view has two different Display modes.
| Display Mode | Description |
|---|---|
| Top Down | The call tree is "normal" - expanding a node reveals the sub-methods that it calls. |
| Bottom Up | The call tree is reversed - expanding a node reveals the method that called it. |
The view has two different Sort modes.
| Sort Mode | Description |
|---|---|
| Total Time | Methods are sorted according to their "total time" (the time spent executing code within the method and the time spent executing sub-calls) |
| Self Time | Methods are sorted according to their "self time" (the time spent executing code within the method) |
Sources View
If you specifically want to look for badly performing plugins or mods, the sources view may be useful.
In the sources view, a separate profiler tree will be shown for each plugin/mod in the profile. The tree is filtered and at the top level, shows all outgoing calls made by the source.
The view has two different Merge modes.
| Merge Mode | Description |
|---|---|
| Merge | Method calls with the same signature will be merged together, even though they may not have been invoked by the same calling method. |
| Separate | Method calls that have the same signature, but that haven't been invoked by the same calling method will show separately. |
Flame Graph
Flame graphs have become a popular way to interpret profiler output.
The viewer makes it easy to view your profile (or a subsection of it) as a flame graph.
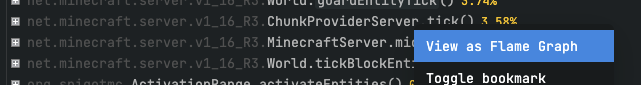
To open the flame view, either click on the Flame icon in the top controls bar, or right-click on a thread/method call and select "View as Flame Graph".
This will open the flame view.
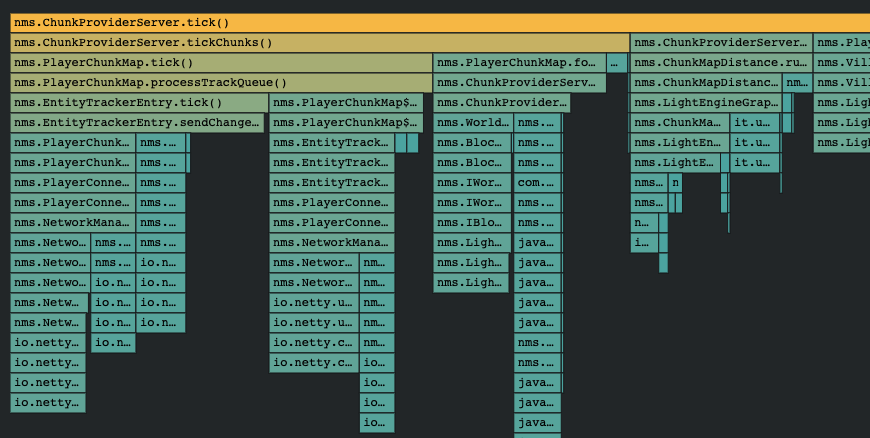
The width of each node in this view corresponds to the portion of time spent executing it.
You can click on a node to "focus" it, and expand it to fill the full width of the page. The child nodes beneath it will expand accordingly.
You can hover over a node to view the full method name & profiled time.
To exit the flame view and go back to the profiler tree, just click the "Exit Flame View" button in the top right of the page.
![]()